
We are increasing our focus on partnering with our Clients to develop influencer video best practices. To date there has been little data published on industry benchmarks for KPIs like Viewership, Engagement Rates and CTRs.
In that spirit we analyzed the nearly 1000 videos that have run through our platform over the past year. Below is a snapshot of the analysis where you will see influencer video performance benchmarks cut in two ways:
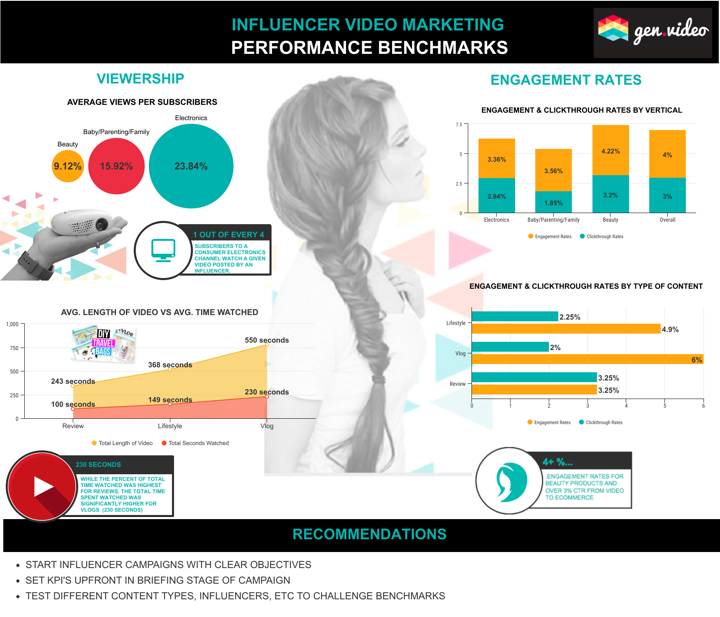
- By vertical (Consumer Electronics, Beauty and Baby/Parenting/Family)
- By type of content (Reviews, Vlogs, Lifestyle)
Snapshot
Overall benchmark for engagement rate (likes, shares, comments) for influencer video on YouTube is 4%. To put this in perspective, over a 1% engagement rate for a Facebook post is generally considered good performance.
Average click through rate from a video on YouTube to an ecommerce page is 3%. Click through rates for influencer video are 30X that of PointRoll video clicks, indicating the impact of peer-to-peer video content on driving traffic to retail.
Engagement rates and click through rates do vary quite a bit by type of content and vertical (see infographic for detail).
Viewership – on average 16% of an influencer’s subscriber base will view a video that is posted (for at least 30 seconds)
On average consumers are watching 40% of a video – again the total time consumers watch a given video varies greatly by type of content with Vlogs ranking highest at 230 seconds.
We hope you find the data helpful! Look for more best practices and insights for Influencer Marketing in the coming months.